Candlestick charts are one of the most commonly used tools in technical analysis. They provide a visual representation of price movements over time and help traders to identify trends and potential trading opportunities. In this blog post, we will discuss the construction of the candlestick chart and how it can be used in trading.
It’s important to note that the candlestick chart originated in Japan and was used to track the price movements of rice in the 17th century. The Japanese have been using this charting method for centuries, and it was not until the 1990s that the technique was introduced to the Western world.
The word “candlestick” was actually coined by Steve Nison, a Western trader who studied the Japanese charting techniques in the 1980s. In Japan, the chart is called Ashi, which means “leg” or “foot.” The Japanese named it as such because they believed that the chart showed the footprints of market players, revealing where they had been and where they were heading.
To draw a candlestick chart, four elements of price data are required: the open, high, low, and close. These elements are used to create the real body, upper shadow, and lower shadow of each candlestick.
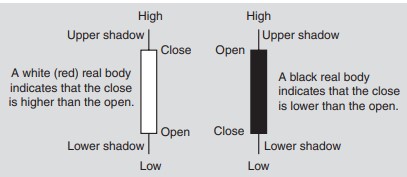
The real body represents the range between the open and close of the session and is boxed up in either red or black depending on whether the close is higher or lower than the open. The upper shadow represents the high of the session, while the lower shadow represents the low of the session.
Candlestick charts provide valuable insights into market trends and can be used to identify potential trading opportunities. Traders can use the different candlestick patterns to make informed decisions about when to buy or sell an asset. For example, a doji candlestick implies indecision in the market and may signal a potential reversal.
In conclusion, understanding the construction of the candlestick chart is essential for any trader looking to use technical analysis. By following the simple steps outlined above, traders can draw their own candlestick charts and use them to identify trends and potential trading opportunities. The candlestick chart is a powerful tool that has been used by traders for centuries and continues to be a popular charting method today.
0 Comments