Japanese candlestick charting is a powerful tool that has gained widespread popularity among professional traders. There are several reasons why this technique has become so popular today. In this blog post, we will explore six key reasons why candlestick charts are so widely used in financial analysis.
1. Leading indicator:
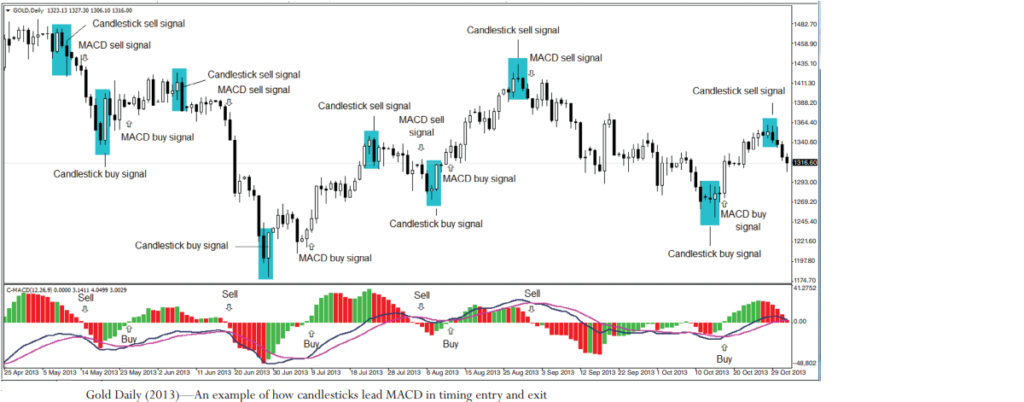
Candlestick charts are a true leading indicator of market action. They have the ability to show reversal signals earlier than Western charting techniques. This means that they can identify potential moves before they become apparent with Western technical tools. Many Japanese candlestick patterns are not found in Western chart techniques, which makes them a valuable addition to any trader’s toolkit.
2. Pictorial:
Candlestick charts are very pictorial and describe the state of players’ psychology at a particular moment. This can be used to make meaningful trading decisions. The terminology used in candlestick charting, such as “hangman,” “shooting star,” “dark cloud cover,” “hammer,” and “abandoned baby,” paints indelible word pictures that can assist the trader to remember the pattern through recalling its name. The candlestick technique consists of hundreds of different pattern groups that accurately identify specific traits and tendencies.
3. Versatile:
Candlestick charts are versatile in that they can be used alone or in combination with Western technical tools. They use the same price data as bar charts, yet the candlestick technique better promotes the ability to recognize complex pattern groups and predict the next possible outcome based on them. This makes them an excellent choice for short-term trading through the use of intra-day charts like the 1-minute, 5-minute, 15-minute, 30-minute, and 1-hour charts. They can also be applied for longer-term forecasting through the use of daily, weekly, and monthly charts.
4. Can be applied to any time dimension:
Candlestick charting techniques can be adapted for either short- or long-term trading. This means that they can be applied to follow as many markets as desired, be they stocks, futures, currency, or commodities.
5. Flexibility and adaptability:
Candlestick charts can be applied to follow as many markets as desired, making them a great choice for traders who want to diversify their portfolio. They can be used to trade Malaysian stocks, index futures, or crude palm oil futures, or to analyze or trade any commodity in any market around the world.
6. Time-tested, dependable, and useful:
The candlestick charting technique is time-tested and has been refined by generations of use in Japan. The fact that it is still very much in use today after more than 300 years since its discovery is testimony to its usefulness.
In conclusion, Japanese candlestick charting is a versatile and powerful tool that has become a favorite among professional traders. Its ability to show reversal signals earlier than Western charting techniques, its pictorial nature, versatility, adaptability, and time-tested dependability make it a must-have for any trader looking to make meaningful trading decisions.
0 Comments