Japanese candlestick charting is a popular tool used in technical analysis of financial markets. It is a visual representation of price movements that has its roots in Japan over three centuries ago. In this blog post, we will explore the history of Japanese candlestick charting, its evolution, and its significance in modern-day financial analysis.
Origins of Japanese Candlestick Charting
The use of candlestick charts was first introduced in Japan during the 18th century by a rice trader named Munehisa Homma. Homma realized that the price of rice was not only affected by the supply and demand but also by the emotions and psychology of the traders involved in the market. He started to keep detailed records of the price movements and began to notice patterns that could be used to predict future price movements.
Homma used a type of charting system that showed the price movements of rice over a specific period, usually a day or a week. These charts were called “rice price charts” and were the predecessor to modern-day candlestick charts. The charts used a series of lines to represent the price movement, with each line showing the opening, closing, high, and low price for a specific period.
The Development of Japanese Candlestick Charting
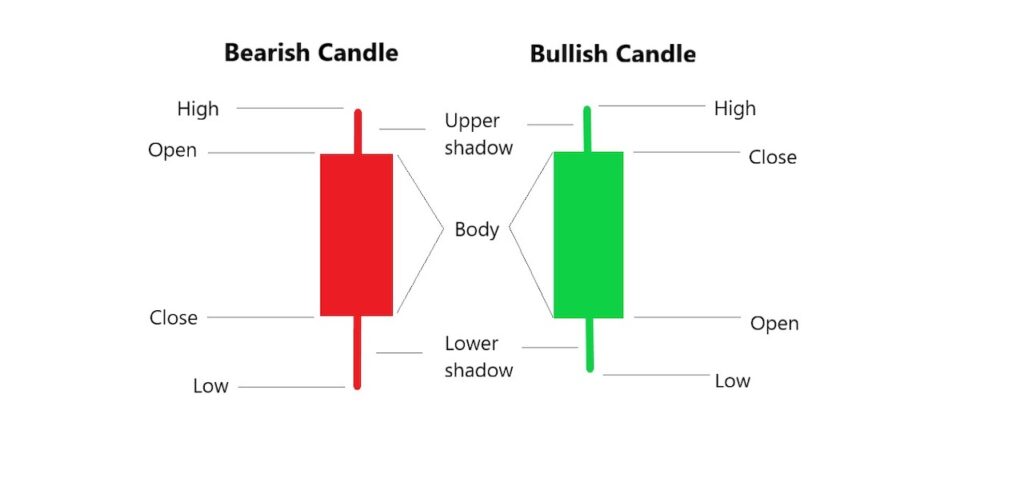
The modern form of candlestick charting was developed in the 1800s by a Japanese rice trader named Sokyu Munehisa. Munehisa refined Homma’s method by using a type of chart that used a single vertical line to represent the price range for a specific period. The line was then surrounded by a rectangle or “body,” which represented the opening and closing price.
Munehisa also introduced several new candlestick patterns, including the “Doji,” a pattern where the opening and closing prices are the same, and the “Hammer,” a pattern that indicates a potential reversal in the trend.
The Significance of Japanese Candlestick Charting
Japanese candlestick charting gained popularity in the West during the 1980s and has since become a standard tool used in technical analysis. Candlestick charts are now used to analyze a wide range of financial instruments, including stocks, commodities, and currencies.
The significance of candlestick charting lies in its ability to provide traders and investors with a clear visual representation of price movements. The chart patterns can help to identify potential trend reversals, support and resistance levels, and other key price levels that can be used to make trading decisions.
Conclusion
The history of Japanese candlestick charting is a testament to the ingenuity of traders who sought to understand the psychology behind market movements. The charts provide a powerful tool for analyzing price movements and identifying potential opportunities for trading and investing. Today, candlestick charting remains a vital part of technical analysis and is widely used by traders and investors worldwide.
0 Comments